Management Discussion and Analysis (MD&A)
Overview of Federal Grid Company’s Financial Condition as of 31 December 2012 and 2012 Operations
This Report contains an overview of the financial performance and operations and the financial performance of Federal Grid Company (hereinafter referred to as the “Company”). The Report should be reviewed in conjunction with the Company’s 2012 financial statements prepared in accordance with corresponding Russian legislation (Russian Accounting Standards (RAS)), including a corresponding explanatory note.
1. General overview of the Company’s operations
Since 2010, tariffs for electricity transmission over the UNEG by Federal Grid Company have been set using the RAB-regulation method, to upgrade the investment attractiveness of the energy sector.
As of 31 December 2012, the Company consisted of regional branches, including 8 Main Electric Grids (MES), 41 Backbone Electric Grid Transmission Line Companies (PMES) and one Bely Rast Specialized Production Base. In 2011, the volume of power transmission services rendered by the Company amounted to RUR136,581.43 million.
The Company makes considerable investments in fixed assets to provide for the development and reliable operation of the UNEG. In 2012, expenditures on construction, re-construction and renovation of the Company’s fixed assets amounted to RUR179,898.9 million (compared with RUR184.716 million in 2011).
The Company financed its 2012 investments from the following sources:
- Revenues generated by power transmission services – 34.4%;
- Borrowed funds, including federal budgetary finds for the current year – 34.4%;
- Funds generated by VAT returns – 14.7%;
- Other sources (including payments for technological connections) – 3.2%.
1.1. Main factors influencing the performance of Federal Grid Company In 2012, the principal factors influencing the Company’s performance include the following:
1. Postponement of the period for setting and revising tariffs from 1 January to 1 July of the next calendar year (Russian Federation Governmental Regulation #1178 dated 29.12.2011) and the establishment of rates for H1 2012 at the level of tariffs set for 2011 (FTS of Russia’s Order #325/e-1 dated 6 December 2011);
2. Modification of the RAB-regulation methodology that means changing to determining a base of invested capital based on the value of assets that have been commissioned within the framework of the investment program. Starting from 1 July 2012, the increase in the average rate of network maintenance amounts to 11% (FTS of Russia’s Order #114-e/2 dated 21.05.2012), with an average annual tariff growth amounting to 4% in 2012. The tariff will grow 9.4% from 07.01.2013 and 9.4% from 01.07.2014;
3. Successful implementation of the cost management program, which reduced the Company’s operating costs;
4. A write-off of negative differences resulting from the mark-to-market revaluation of securities that are listed on the market (primarily JSC Inter RAO UES shares);
5. Accrual of provisions for the devaluation of financial investments (not subject to revaluation at market value) (bills owned by LLC Energo-Finans, equity investments in the shares of JSC Mobile GTES);
6. A negative balance of operations involving the establishment and recovery of the bad debt reserve (mainly due to revaluation, at current market value, of energy companies’ shares which were on the balance of the Index of Energy of Federal Grid Company and accrued interest on LLC Energo-Finans’ bills);
7. Reflection of the revaluation of fixed assets.
2. The Company’s financial results
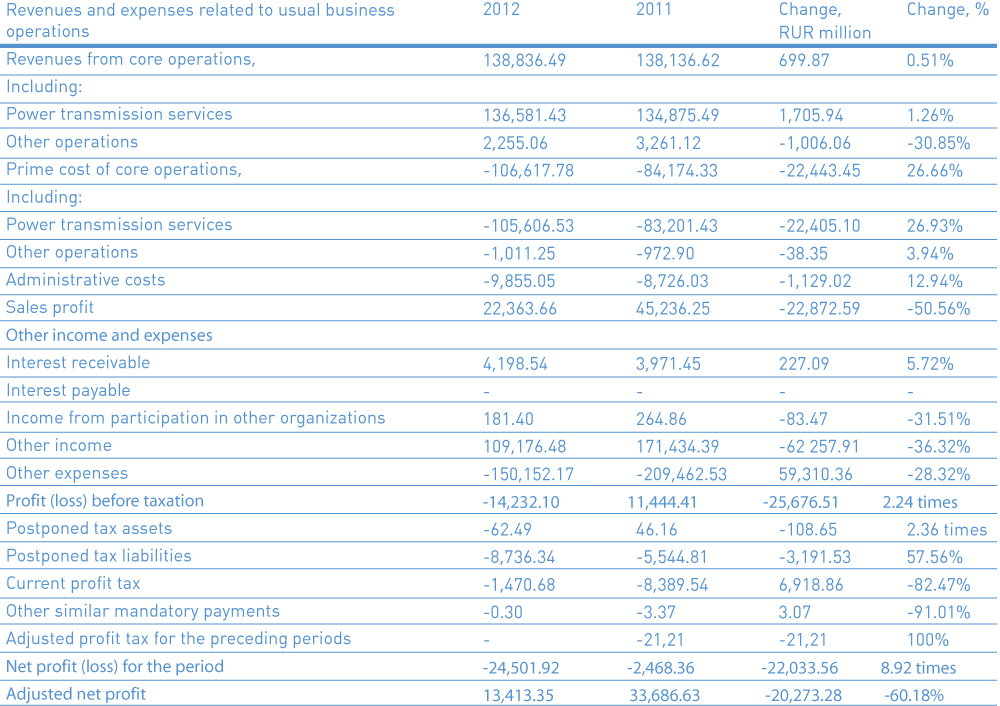
2.1. Key financial results
2.2. Revenues generated by power transmission services
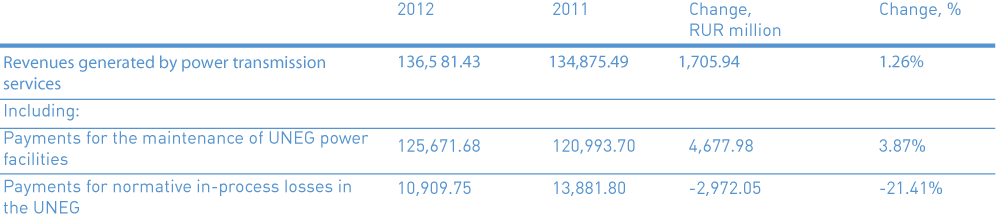
An analysis of the 2011-2012 period demonstrates increased revenues generated by power transmission services.
Compared with 2011, revenues generated by power transmission services in 2012 grew RUR1.706 million, including:
—A RUR4,677.98 million increase in revenues related to power grid facility maintenance, mainly due to the growth in tariffs for power transmission through the UNEG starting from 01.01.2012;
—A RUR2, 972.05 million decline in revenues for the compensation of normative losses, due to a reduction in loss limits that are compensable to consumers, from 4.84% to 4.49%.
In 2012, revenues generated by the Company’s core regulated operations (excluding revenues from technological connections) made up 98.38% of the Company’s total revenues.
2.3. The prime cost of core operations
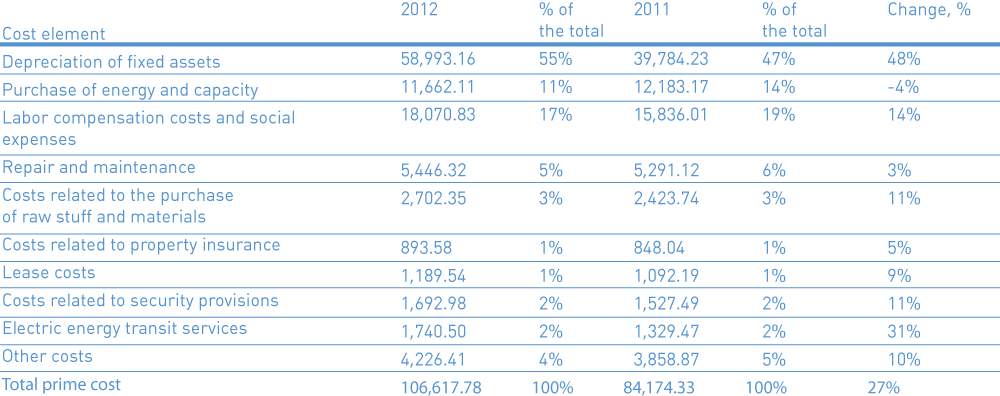
2.3.1. Depreciation of fixed assets
Compared with 2011, depreciation charges grew 48% in 2012. The 2012 growth in depreciation costs occurred due to accrued depreciation from new power grid facilities commissioned within the framework of implementing the Company’s investment program and the revaluation of fixed assets.
2.3.2. Purchase of energy and capacity
In 2012, costs related to the purchase of energy and capacity fell 4% compared with the similar period in the preceding year. This was due to the optimization of power flows and the ongoing energy saving program, which enabled the actual percentage of losses in Federal Grid Company’s networks to be reduced to 4.24% and resulted in a RUR521 million decline in the costs related to the purchase of electric energy and capacity to compensate for transmission losses, compared with 2011.
2.3.3. Labor compensation costs and social expenses
The 14% growth in labor compensation costs and social expenses occurred due to: (1) an increase in the number of employees employed to ensure the functioning of commissioned electric grid facilities and (2) the quarterly indexation of production employees’ salaries, which are performed in accordance with the actual growth in the consumer price index, in accordance with Tariff Agreement adopted by the Company and the policy of maintaining employees’ real income level and (3) an increase in insurance premiums due to legislative changes (increased regulatory framework from RUR463 thousand to RUR512 thousand and the establishment of insurance premiums at a rate of 10% of the payments in excess of the limit value of the framework).
2.3.4. Repair and maintenance
The 3% increase in repair and maintenance costs in 2012 compared with 2011 occurred due to inflationary factors, as adjusted by savings via procurement procedures.
2.3.5. Cost of raw stuff and materials
In 2012, costs related to the purchase of raw stuff and materials grew 11% compared with 2011, which occurred due to increased costs for raw stuff and materials, fuel for vehicles due to inflationary factors, and the cost of work clothing, because of the growth in production staff, including for newly commissioned electric grid facilities.
2.3.6. Property insurance costs
In 2012, property insurance costs increased 5% due to the expansion of the list of insured production equipment (due to commissioning), as well as insurance for assets under construction.
2.3.7. Lease costs
In 2012, lease costs increased 9% compared with 2011. This was primarily due to an increase in lease payments under the contract for utilizing electric grid facilities of JSC Yantarenergo, a growth in the property lease costs for commissioned wireless communication networks. Also, there was an increase in land lease fees due to tariff indexation by local authorities.
2.3.8. Costs related to security provisions
The 11% year-on-year growth in costs related to security provisions was caused by an increase in the number of protected facilities, including for newly commissioned ones, as part of the Company’s large-scale investment program, upgrading the physical security of facilities, introducing the Integrated Automated Security Management System (IASMS) at the Company’s power facilities and Unified Security Control Center (USCC) and by implementing a program to protect UNEG facilities against terrorism.
2.3.9. Expenditures on electric energy transit services
In 2012, expenditures on electric energy transit services grew 31% compared with 2011, which was due to increased power flow through foreign energy systems, as well as a significant 16% indexation of tariffs for electric energy transit through the UES grids of Kazakhstan.
2.3.10. Other costs
In 2012, other costs grew 10% as compared with 2011, due to conducting a power survey (power audit) of electric grid facilities in the reporting year within the framework of the energy saving and efficiency program, as well as due to measures to establish protective zones.
2.4. Administrative costs
Увеличение прочих расходов в 2012 году на 10% по сравнению с 2011 годом связано с проведением в 2012 году работ по энергетическому обследованию (энергоаудит) объектов электросетевого хозяйства в рамках реализации программы энергосбережения и повышения энергетической эффективности, а также проведением мероприятий по установлению охранных зон.
2.4. Administrative costs
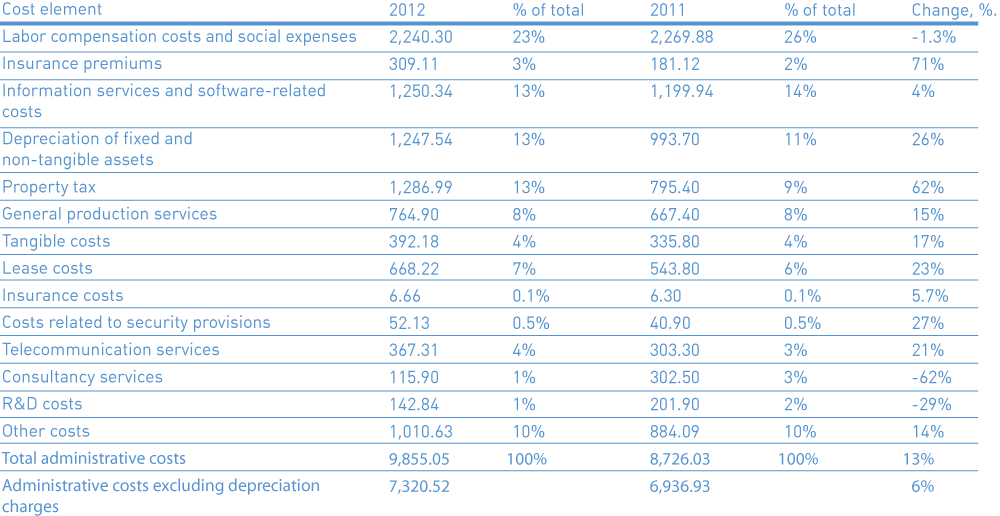
2.4.1. Labor compensation costs and social expenses
РLabor compensation costs fell 1.3% in 2012 compared with 2011 due to optimizing the number of managerial staff.
2.4.2 Insurance premiums
In 2012, insurance premiums grew 71% as compared with 2011 due to legislative changes (an increase in the regulatory framework for insurance premiums from RUR463 thousand to RUR512 thousand and the establishment of insurance premiums at the rate of 10% of the payments in excess of the limit value of the framework).
2.4.3. Information services and software-related costs
During the reporting year, costs related to information services grew 4% due to commissioning new information programs that provide control over the Company’s obligations and their compliance with financing limits.
2.4.4. Depreciation of fixed and non-tangible assets
The 26% increase in depreciation costs was caused by fixed asset revaluation.
2.4.5. Property tax
The 62% increase in property tax (compared with 2011) was caused by commissioning new UNEG facilities and revaluing fixed assets (in accordance with the accounting policy, the cost item in question fully reflects property tax, including the tax imposed on the Company’s production assets).
2.4.6. Production services
The 15% growth in costs related to production services was caused by an increase in transportation costs not related to the transport of goods, legal services, with a simultaneous reduction in audit services at the end of competitive procedures, as well as advertising costs, including participation in exhibitions and fairs.
2.4.7. Tangible costs
The 17% growth in tangible costs in 2012 (compared with 2011) was caused by an increase in operating costs to maintain the backup data processing center, as well as intercom and video-conferencing maintenance costs.
2.4.8. Lease costs
The 23% increase in lease costs in 2012 compared with 2011 was due to increased spending on counter-lease contracts for fiber-optic communications and the change in contractual relationships with the owner of the leased building (9 Bolshoy Nikolovorobinskiy Lane), in terms of increasing the number of leased areas and their sub-leasing to JSC ECMC UES.
2.4.9. Insurance costs
The 5.7% growth in insurance costs compared with 2011 was caused by increased costs of liability insurance, associated with increased personal responsibility for members of the Board of Directors, members of the Management Board, the Chief Accountant and officials of Federal Grid Company, due to the planned implementation of numerous strategic transactions.
2.4.10. Communication services
The 21% increase in communication costs in 2012 compared with 2011 was caused by indexing communication operators’ tariffs and commissioning new satellite communication systems.
2.4.11. Consulting services
The 62% decrease in consulting services occurred due to a reduction in the number of consulting companies involved and the performance of necessary work in-house by corporate employees.
2.4.12. Research and development (R & D) costs
The 29% decrease in R&D costs in 2012 (compared with 2011) was caused by a one-time write-off of R&D in 2011 with a positive result, on which patents were not issued.
2.4.13. Other administrative costs
The 14% increase in other administrative costs in 2012 (compared with 2011) was primarily caused by an increase in costs related to medical insurance and non-State retirement insurance to upgrade employees’ social protection. The growth of administrative costs (excluding depreciation charges and property tax) at the end of 2012 amounted to 6% compared with 2011, which corresponds to the inflation rate.
2.5. Profits from core operations
The 50.5% decrease in profits from core operations in 2012 compared with 2011 was caused by maintaining the Company's revenues at the 2011 level (an increase of 0.51%), which was due to the postponement of tariff indexation for electricity transmission from 1 January to 1 July, with a simultaneous growth rate in prime cost and administrative costs primarily due to increased costs, associated with the ownership of property - depreciation charges and property tax.
2.6. Interest receivable and interest payable
Interest receivable is composed of income generated by debt financing and revenues generated by depositing free cash in bank accounts and deposits. In 2012, the amount of interest income increased 5.7% compared with 2011 as a result of measures aimed at upgrading the efficiency of the Company’s current assets management, which generated additional revenue in the amount of RUR227 million compared with 2011. Due to changes in the Company’s accounting policy, interest costs have been capitalized and included in the cost of construction titles since 2010. This explains why interest payable is not reflected in the corresponding line of the report.
2.7. Other income
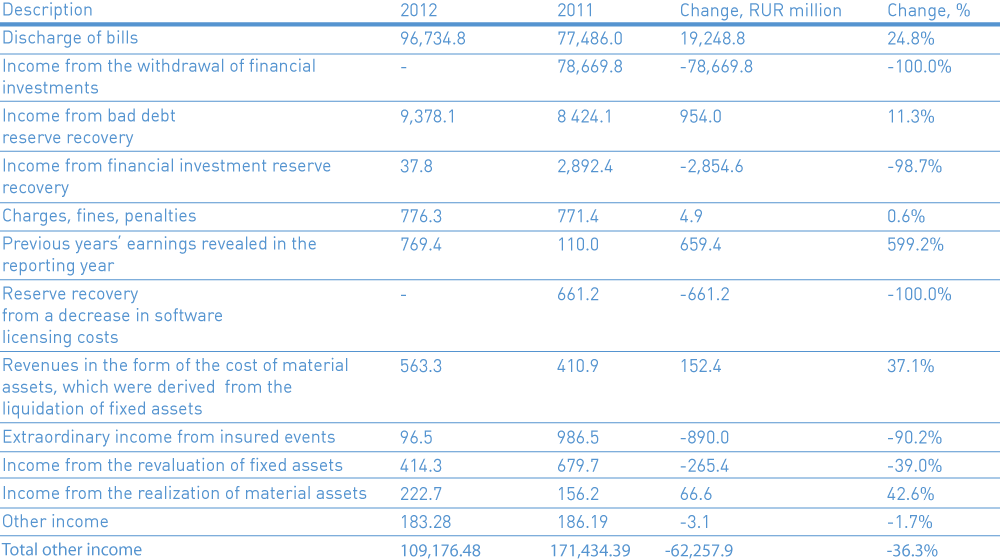
In 2012, the Company’s other income decreased 36.3% compared with 2011, mainly due to the fact that the sale/exchange of generating companies’ shares for shares of JSC Inter RAO UES was reflected in 2011 operations.
2.8. Other costs
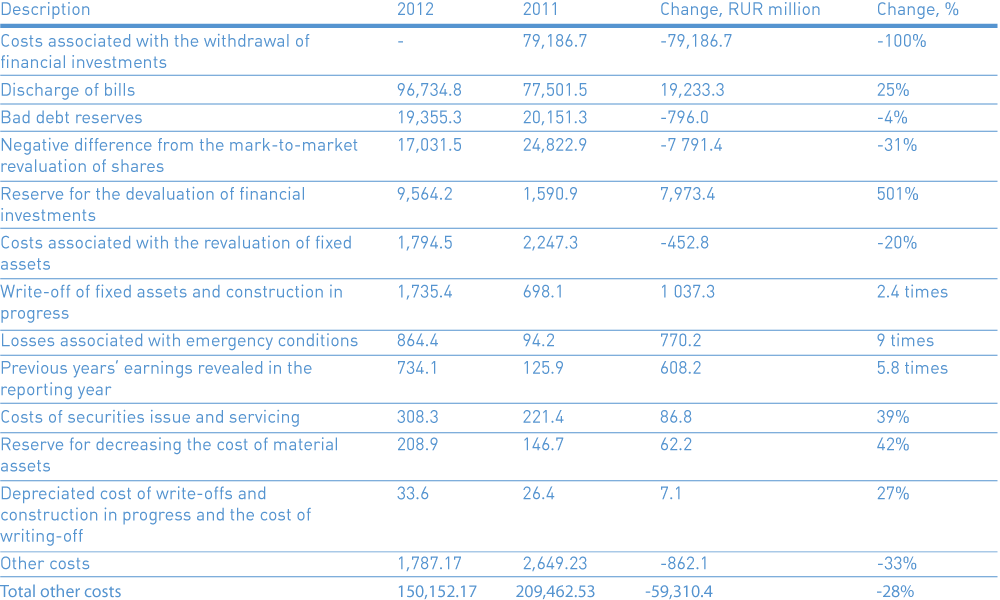
In 2012, the Company’s other costs decreased 28% compared with 2011 mainly due to the fact that the transaction involving the sale/exchange of generating companies’ shares for shares of JSC Inter RAO UES were reflected in 2011, as well as the revaluation difference for the Company’s financial investments, as reflected at the end of the reporting periods.
2.9. Income/ expense associated with the withdrawal of financial investments
In 2012, there was no financial results from the re-payment of third party bills (in 2011, expenses in the consolidated expression amounted to RUR516.8 million, mainly due to the fact that 2011 reflected a transaction involving the exchange of generating companies’ shares for shares of JSC Inter RAO UES).
2.10. Revaluation of financial investments
In 2012, the Company reflected a negative difference from the mark-to-market revaluation of shares. The negative difference amounted to RUR17,031.5 million. This was mainly due to the revaluation of OJSC Inter RAO UES shares, which were on the Company’s balance at market value.
In addition, in 2012, the Company undertook measures to establish/recover a reserve for the devaluation of financial investments (not subject to revaluation at market value). The balance was RUR9,526.4 million (mostly on LLC Energo-Finans’ bills and equity investments in shares of JSC Mobile GTES).
2.11. Provisions for the impairment of accounts receivable
ВIn 2012, based on an evaluation of accounts receivable and the probability that these accounts would be re-paid, the Company established a bad debt reserve in the amount of RUR19.355 million and also recovered a reserve in the amount of RUR9.378 million, which had been established in 2011. A negative financial result from the above-mentioned operations amounted to RUR9.977 million, including:
The balance of the establishment and the recovery of the reserve for bills owned by LLC Index of Energy of Federal Grid Company, which amounted to ( ) RUR6.904 million; A reserve for interest on bills owned by LLC Energo-Finans in the amount of ( ) RUR4.621 million was established;
The balance of the establishment and recovery of the reserves mainly for the service contracts for electricity transmission through the UNEG, which amounted to (-) RUR1.548 million. In 2011, the financial result from the recovery and establishment of bad debt reserves amounted to RUR11,727.19 million (the recovered reserve was RUR8,424.10 million, whereas the established reserve totaled RUR20,151.29 million).
2.12. Current profit tax
Compared with the previous year, in 2012, total profit tax fell 82.5% to amount to RUR1,470.68 million. The change in profit tax was caused by an increase in the value of depreciation charges, which are deductible in tax accounting, due to the large inputs of power grid facilities in fixed assets.
2.13. Net profit (loss) in the reporting period
The Company’s FY 2012 loss amounted to RUR24,501.9 million (whereas, the 2011 loss was RUR2,468.4 million). The Company’s loss occurred due to the following factors:
— A write-off of negative difference resulting from the revaluation of securities, listed on the market, at market value (mostly JSC Inter RAO UES) in the amount of RUR17,031.5 million;
— A negative balance of operations involving the establishment and recovery of reserves for the devaluation of financial investment (not subject to revaluation at the market value), which amounted to RUR9,526.4 million (mostly on bills owned by LLC Energo-Finans and equity investments in the shares of JSC Mobile GTES);
— A negative balance of operations involving the establishment and recovery of bad debt reserves in the amount of RUR9,977.2 million (mainly due to the revaluation of energy companies’ shares which were on the balance of the Index of Energy of Federal Grid Company and interest on LLC Energo-Finans’ bills).
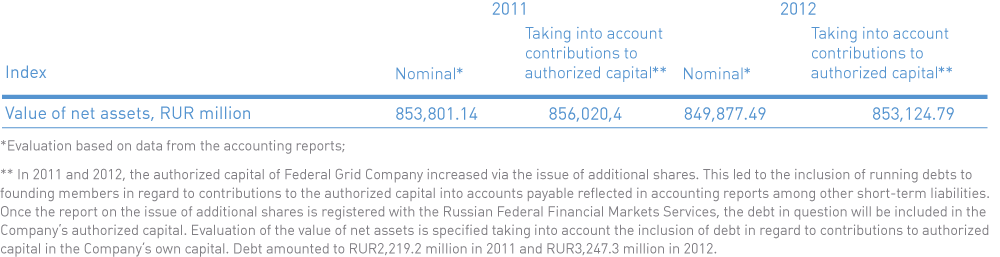
3. The Company’s net assets
According to accounting report data, in 2012, the value of Federal Grid Company’s net assets decreased RUR3,923.7 million compared with the similar period in 2011 and by RUR2,895.6 million, according to an evaluation based on assumptions.
4. Cash flow
4.1. General information on the Company’s cash flow generated by core, investment and financial operations
On 31 December 2012, the Company’s total cash was RUR17,527.6 million (compared with RUR17,247.7 million on 31 December 2011).
The receipts and expenses analysis below was based on management accounting of corporate cash flow, taking into account mutually exclusive turnovers on deposits and dissolved contracts for electric energy transmission services.
In 2012, the Company physically received cash in the amount of RUR313.794 million, which is RUR20.246 million less than 2011. Compared with 2011, actual payments effected by the Company decreased RUR14.523 million to stand at RUR313.513 million.
The table below contains information on the Company’s cash flows associated with core, investment and financial operations during the corresponding periods.
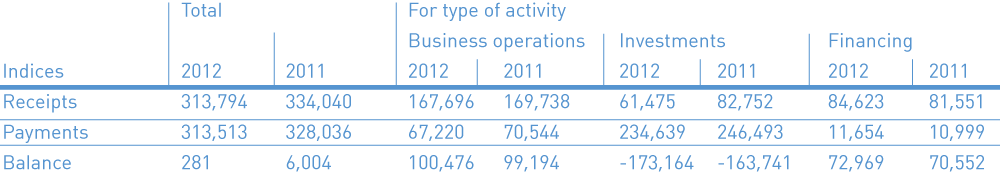
The financing of investment programs for other power grid facility owners (based on contractor agreements) in 2012 amounted to RUR363 million, expenses for the purchase of fixed assets for production needs amounted to RUR852 million, whereas expenses for the purchase of financial investments during the year to deposit temporarily free cash amounted to RUR52.009 million. Dividends were not paid out for the year.
4.2. Cash from running operations
During FY 2012, cash received from running operations decreased RUR2.042 million (-1.2%) compared with the preceding year. The decrease was mainly due to a RUR2,855 million decline in refunds from previously paid taxes (VAT) in 2012 compared with 2011, as well as a cutback in the amounts paid by consumers for corporate services and factors presented in the Section entitled, “Receipts from power transmission services”.
In 2012, the amount of cash spent to finance running operations decreased RUR3.324 million (-4.7%) compared with 2011. This occurred due to a reduction in profit tax payments by RUR8.008 million, a decline in the payment for electric energy to cover losses for its transmission by RUR1.016 million and an increase in the payments for operating expenses by RUR5.700 million, including property tax.
4.3. Cash used in investment operations
Cash received from investment operations decreased RUR21.277 million in 2012 compared with 2011, due to a decline in receipts associated with the withdrawal of short-term financial investments (bills).
Compared with 2011, cash payments associated with investment operations decreased RUR11.854 million, including RUR7.266 million to finance the Company’s investment budget (including RUR4,817.4 million to finance the investment program).
The main directions of financing and the financing sources for the investment program are presented in the "Investments" section.
Also in 2011, 2010 dividends in the amount of RUR2.578 million were paid out to Company shareholders. In 2011, the Company had a loss. Dividends were not paid out in 2012.