Financial Performance
Federal Grid Company demonstrated the following 2012 year-end financial results:
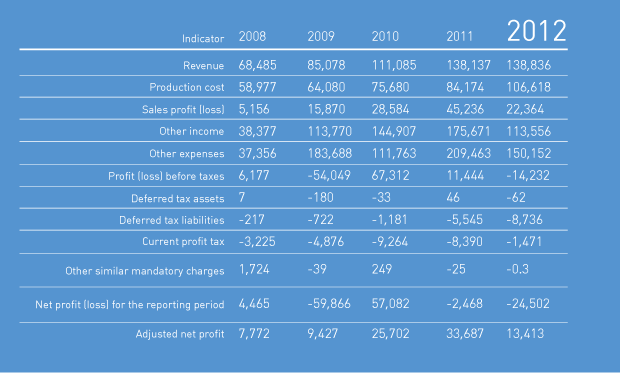
Indicators for the reviewed period (2010-2012) show sustainable growth in the revenues of Federal Grid Company. In 2012, sales revenues from the Company’s main business increased RUR699.9 million compared with the same period from the previous year.
Main growth drivers include: tariff revision in April 2011 and the change in the time for switching over to an annual tariff from 1 January to 1 July, resulting in 4% growth in revenues generated from electric energy transmission in 2012.
However, the 4% revenue growth was offset by the impact of factors beyond the Company’s control - lower revenue from other areas of regulated activities:
- Revenue from compensating technological losses (-21%) due to a lower fixed rate of losses (from 4.84% in 2011 to 4.49% in 2012);
- Revenue from technological connection (-49%).
In 2012, the prime cost of the Company’s services (without administrative expenses) increased RUR24,444 million (26.7%) year-on-year due to increased depreciation charges on the newly commissioned UNEG facilities, as part of the Company’s investment program (depreciation charges amounted to RUR60,241 million in 2012 and RUR40,778 million as of the end of 2011).
The Company’s 2012 financial and business results recorded losses of RUR24,502 million (a RUR2,468 million loss was recorded in 2011). The losses resulted from:
- Reflection of a negative difference resulting from the revaluation of financial investments (mainly JSC Inter RAO UES shares) at market value in the amount of RUR17,031.5 million.
- The negative balance for the establishment and recovery of financial investments impairment reserves (which market value is not established), which amounted to RUR9,564.24 million, including RUR8,610.4 million from ENERGO-Finance LLC bills and RUR953.6 million on financial investments in JSC Mobilnye GTES shares;
- The negative balance for the establishment and recovery of bad debt reserve in the amount of RUR9,977.2 million, including RUR6,904 million from Index Energetiki – FSK LLC bills (due to revaluation of shares on the Company’s balance sheet in accordance with current market value), RUR4,621 million as a reserve on interest accrued from ENERGO-Finance LLC bills and from electric energy transmission services agreements with JSC Yantarenergo, JSC DRSK and JSC Dagenergoset.
- Reflection of revaluation of fixed assets which made a negative effect in the amount of RUR1,380.2 million.
Adjusted net profit (profit without losses from asset revaluation and operations involving the establishment and recovery of bad debt reserves and securities impairment reserve) is RUR13,413 million, a RUR20,274 million decrease from 2011.
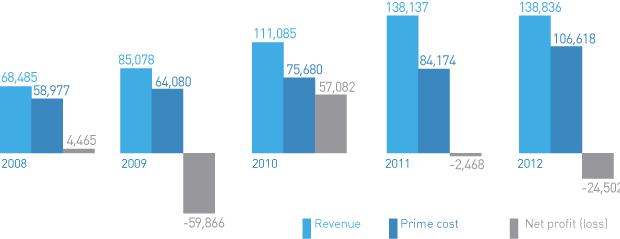
2008-2012 dynamics of revenue, expenses and net profit, RUR million
2008-2012 key assets, equity and liability indicators, according to the Company’s financial statement
| Name of indicator, RUR million | 31.12.2008 | 31.12.2009 | 31.12.2010 | 31.12.2011 | 31.12.2012 |
|---|---|---|---|---|---|
| Total assets | 696 988 | 746 667 | 902 110 | 1 037 493 | 1 122 995 |
| Non-current assets value | 518 471 | 588 425 | 767 152 | 919 501 | 1 011 667 |
| Current assets value | 178 516 | 158 242 | 134 958 | 117 992 | 111 329 |
| Total liabilities | 696 988 | 746 667 | 902 110 | 1 037 493 | 1 122 995 |
| Shareholder equity | 639 329 | 665 436 | 794 192 | 853 526 | 849 602 |
| Long-term liabilities | 18 518 | 7 440 | 152 668 | 138 166 | 209 481 |
| Short-term liabilities | 39 141 | 73 791 | 55 250 | 45 801 | 63 912 |
The dynamics of the above-mentioned balance sheet indicators show a clear growth trend. During 2010-2012, the Company’s total assets and liabilities saw a material growth due to an increase in non-current assets and a growth in long-term and medium-term liabilities.
In 2012, Federal Grid Company’s total assets increased RUR85,502 million (+8.24%) to amount to RUR1,222,995 million, as of 31 December 2012.
Non-current assets increased 10% to amount to 1,011,667 million, which was due to:
- An increase in fixed assets commissioned in 2012 as part of Federal Grid Company’s investment program;
- Decline in financial investments (-35.64%), resulting from them being revalued at market value.
Current assets decreased 5.6% to amount to RUR111,328 million. The following circumstances affected the change in current assets:
- Inventory decreases due to the optimization of the Company's inventory;
- Reduction in short-term financial investments due to the allocation of some part of funds to finance the Company’s investment program;
The Company's capital reduction of RUR3,923 million during the reporting year was due to recording a RUR24,502 million loss, which was partially offset by a RUR2,219 million increase in Federal Grid Company’s authorized capital owing to the registration of the 2011 additional equity issue with the Federal Financial Markets Service, and as a result of reflecting the annual fixed asset revaluation in the amount of RUR17,726 million (+8.9%).
In 2012, Federal Grid Company’s borrowings increased RUR83,815 milli compared with the same period of last year to amount to RUR215,589 million. This was due to raising long-term loans and bond issues to finance Federal Grid Company’s investment program.
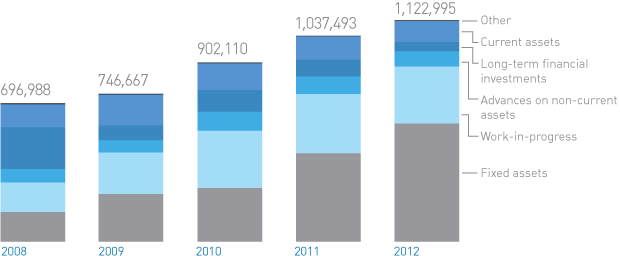
2008 — 2012 structural asset changes, RUR million
Liquidity indicators for Federal Grid Company’s 2012 performance showed the Company’s ability to re-pay its short-term liabilities. The above-mentioned indicators show a relatively high level of liquidity and solvency.
2008-2012 Corporate Financial Indicators
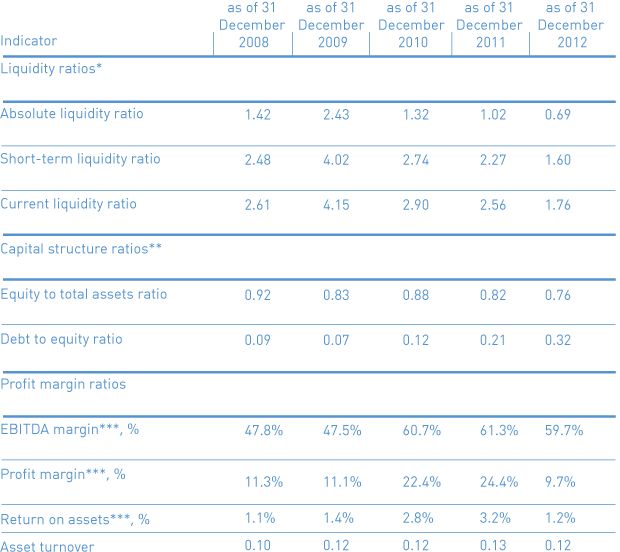
** To calculate the above-mentioned indicators, equity includes debt to shareholders on monetary assets contributed to pay for the issued shares.
*** For the purpose of calculating the above-mentioned indicators, EBITDA (net profit) includes no factors that are external to the Company’s management competency.
Despite the decline, the liquidity ratios that are presented as of 31 December 2012 are within a normal range. The decrease in current, quick and absolute liquidity ratios is associated with decreased short-term financial investments.
The addressed period saw an insignificant reduction in the equity to total assets ratio, which was driven by growth in the Company’s loan portfolio (raising loans and bonded loans to finance the investment program.) Nevertheless, the ratio is good and shows the strong financial sustainability of Federal Grid Company.
On the whole, Federal Grid Company maintains a high liquidity level and a good equity to total assets ratio; its equity constitutes 76% of assets.
Key Principles on Using Available Cash
Available cash management is based on ensuring the maximum efficiency of investment and an optimal risk/return ratio.
In the reporting year, returns on financial investments were generated from investing available corporate cash into Russia’s top banks with the highest reliability level. The banks were selected based on an assessment of their financial operations and the establishment of a risk limit. The main investment instruments relied on the investment term and included bank deposits, current account balances and bank notes.
In 2012, the Company’s good performance was driven by reasonable liquidity management and streamlining the investment structure (in terms of returns on investment and minimizing risks).
Net Profit Distribution
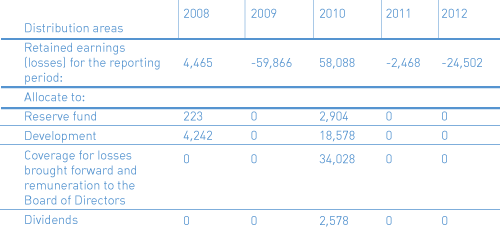
The after-tax profit (net profit) of Federal Grid Company defined by financial statements is the source for reserve fund accrual and dividend payments. According to Federal Grid Company, looking at 2011 FY performance, the Company recorded losses of RUR24,502 million driven by the revaluation of financial investments in market-quoted shares and the recording of the accrual and reversal on provisions for doubtful debt.
2008-2012 Net Profit Distribution, RUR million
